Summary
Key questions
- What has been the overall trend in households’ energy consumption in the EU since 2010?
- What are the main drivers of the energy demand of households in the EU?
Lead authors: Bruno Lapillonne, Zineb Raji (Enerdata)
Reviewers:
A stable share in final consumption and direct CO2 emissions since 2010
At an EU level, the household sector accounted for 28% of final energy consumption in 2023, with a relatively stable share since 2010. The sector’s share has also been stable, with an 18% reduction in the emission factor, while it has lost 3 percentage points since 2010 if indirect emissions from electricity generation are included. The energy mix has seen an increasing share of electricity, heat, and renewables.
Increasing energy prices and declining consumption since 2020
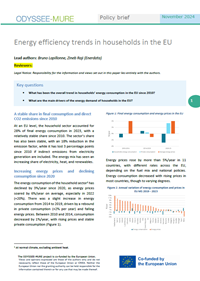
The energy consumption of the household sector1 has declined by 3%/year since 2020, as energy prices soared by 6%/year on average, especially in 2022 (+20%). There was a slight increase in energy consumption from 2014 to 2019, driven by a rebound in private consumption (+2% per year) and falling energy prices. Between 2010 and 2014, consumption decreased by 1%/year, with rising prices and stable private consumption (Figure 1).
Figure 1: Final energy consumption and energy prices in the EU

Energy prices rose by more than 5%/year in 11 countries, with different rates across the EU, depending on the fuel mix and national policies. Energy consumption decreased with rising prices in most countries, though to varying degrees.
Figure 2: Annual variation of energy consumption and prices in EU MS 2019 - 2023

Energy consumption per dwelling has been declining in most EU MS since 2010 (-1%/year at EU level), reaching 1.26 toe/dwelling at an EU level in 2022. Significant disparities are observed between countries, even after adjustment to the same climate, with consumption ranging from around 0.5 toe/dwelling in Malta to 2.1 toe in Luxembourg.
Figure 3: Energy consumption per dwelling*, scaled to EU average climate

Space heating remains the dominant end-use despite a decline in its specific consumption
Space heating consumption has declined slightly since 2010 (-0.6%/year), but it remains the dominant end-use with 64% of household consumption in 2023. Consumption and share for water heating (15%), electrical appliances (12%), and cooking (6%) have remained relatively stable. Lighting consumption has decreased by 1.6% per year, but its share remains stable at 2%. Cooling consumption has grown by 5.5%/year, although it still represents a marginal share (0.7%).
Figure 4: Household energy consumption by end-use in the EU

The specific consumption of households for space heating in koe/m2 has decreased in all countries since 2000 (-1.7%/year on average in the EU). Six countries have seen a faster decline, exceeding 2.5%/year (Ireland, Latvia, Luxembourg, Netherlands, Romania, Slovenia)
Figure 5: Households space heating consumption per m2*

*At normal climate; ambient heat excluded; 2003 for Portugal;. No data before 2016 for Malta ; No data on m2 for Belgium
The reduction has accelerated since 2019 for the 10 largest consumers* (-2%/yr at EU level) with a rapid decline in 60% of these countries. This trend was driven by strong price increases in 2022 and possibly sustained efforts in energy efficiency, although this is difficult to confirm due to limited data, particularly on renovation works. From 2014 to 2019, the decrease was minimal in half of the countries, especially in some of the largest (e.g., Germany, the Netherlands). An increase was observed in Poland, partly driven by low prices and higher income.
Figure 6: Unit consumption for space heating in the 10 largest consumers*

* Countries representing 85% of the EU heating consumption of households, of which Germany 25%, France 17%, Italy 13%, Poland 8%. Belgium toe/dwelling
Specific consumption of large appliances (measured in kWh per appliance) has decreased steadily since 2000 thanks to labelling and eco-design measures.
Washing machines achieved the highest improvements (5%/year), followed by cold appliances (refrigerators and freezers), dish washers, and dryers (4%/year) (Figure 7).
Figure 7: Specific energy consumption of large appliances (EU average)
")
Acceleration in energy efficiency improvement since 2019
Household energy efficiency has improved by 30% since 2000 (1.5%/year), with most progress occurring before 2014 (1.7%/year) and after 2019, while improvements slowed between 2014 and 2019 (0.8%/year). Progress has mainly been driven by efficiency gains in heating, lighting, and appliances, whereas no improvement has been recorded in cooking and water heating since 2014.
Figure 8: Energy efficiency trends for households at EU level based on ODEX

2023: Early estimates
Since 2020, annual additional energy savings are back to their historical progression
Average annual additional savings have rebounded since 2020, returning to their historical level of around 5 Mtoe/year (Figure 9). This represents 2% of household consumption, which is higher than the Article 8 target (1.35% on average over 2021-2030 for all sectors). Heating accounts for the majority of these savings, with a share exceeding its share in consumption (84% of savings since 2020, compared to 64% of consumption). Annual savings slowed down significantly over 2015-2019.
Figure 9: Average annual additional savings for households (EU)
")
Cumulated annual energy savings since 2000 reached 92 Mtoe in 2023 (the equivalent of 39% of household consumption that year). Without these savings, energy consumption would have been 39% higher in 2023. Households are overrepresented in total savings, accounting for 39% of savings compared to a 28% share of consumption.
Figure 10: Cumulated annual energy savings in the EU 2000 - 2023

Since 2019, energy savings and behaviours more than offset the activity effect
Between 2019 and 2023, consumption decreased, driven by energy savings (-18 Mtoe) and behaviours (-5 Mtoe), which more than offset the activity effect (+11 Mtoe) (increase in the number of dwellings, more appliances per dwelling and larger homes). The climate also had an impact, almost equivalent to the behavioural effect.
Figure 11: Drivers of energy consumption variation for households (EU) 2019 – 2023 (real climate)
 2019 – 2023 (real climate)")
Consumption decreased significantly between 2010 and 2019 (- 35 Mtoe), driven to a great degree by climate (-29 Mtoe), as 2019 was much warmer than 2010. The 'activity effect' contributed to a 21 Mtoe rise in consumption, which was more than offset by energy savings (26 Mtoe).
Figure 12: Drivers of energy consumption variation for households (EU) 2010 – 2019 (real climate)
 2010 – 2019 (real climate)")
Main conclusions
The energy consumption of households has declined rapidly since 2020, driven by increasing energy prices.
Household energy efficiency improved by 1.5%/yr since 2000, with most progress achieved before 2014 and after 2019.
Energy savings for households reached 92 Mtoe in 2023, with annual savings back to their historical trend since 2020 (5 Mtoe/year). Progress has mainly been driven by efficiency gains for heating, lighting, and appliances.
Because of large climate variations over the years, it is important to analyse trends at normal climate. It is also necessary to exclude the ambient heat from heat pumps from the household consumption to get a true insight as to the actual consumption variation2.
Notes
- 1: At normal climate, excluding ambient heat.
- 2: For instance, the space heating consumption per m2 has decreased by 1.3%/year at an EU level without ambient heat but by only 0.9% if ambient heat is included
November 2024