Summary
Key questions
- What has been the overall trend in heat consumption in the EU since 2014?
- What are the main drivers of heat demand in the household sector in the EU?
Lead authors: Anna Volkova (Taltech)
Reviewers: Mark Anthony Callus (The Energy & Water Agency)
General overview
Europe consumes half of its energy for heating and cooling purposes. Most of this thermal energy is used in buildings and industry1. In the following overview, the trends of heat production and consumption in the EU member states have been compared with the EU average, and some main indicators of heat consumption have also been presented.
Based on data from the EUROSTAT and ODYSSEE database, the main drivers of energy consumption at the EU level have also been examined.
Production of heat
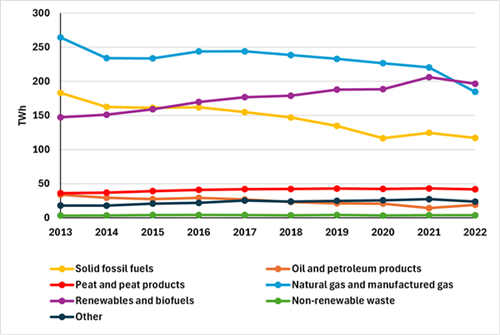
EU total gross production of derived heat in 2022 amounted to 586 TWh, or 9.1% less than in 2021. The highest share of heat was produced from renewable energies (33.5%), followed by natural gas and manufactured gases (31.5%) and solid fossil fuels (20.0%).
Heat production in the period from 2014 to 2022 has decreased by approximately eight percentage points, including heat production from oil and petroleum products by 36 percentage points, from solid fossil fuels by 28 percentage points, and from natural gas 21 percentage points. At the same time, heat production from waste and other sources, renewable energy sources, and peat has increased (39, 30, and 13 pp, respectively). The detailed data on gross heat production by fuel are presented in (Figure 1).
Figure 1: Production of heat by fuel, EU27
Source: Eurostat
Consumption of heat by end-use sectors
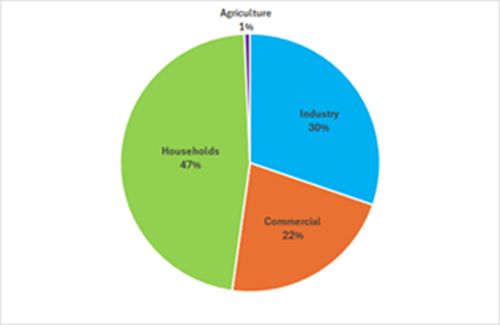
As can be seen from Figure 2, the most heat in EU27 is consumed in households (ca. 47%), followed by industry (30%) and the business and public sector (22%). Heat consumption in the agricultural sector is marginal (ca. 1%).
Figure 2: Heat consumption by end-use sectors in EU27, 2022
Source: Eurostat
Heating and cooling degree days
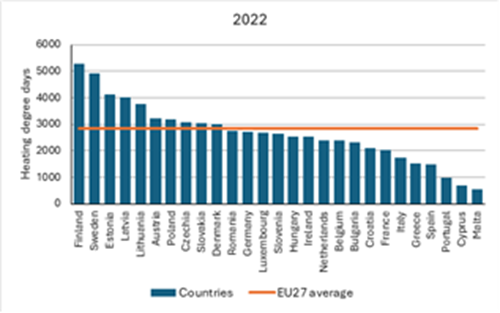
The geographic location of the country plays a key role in heat consumption for residential and non-residential heating and cooling. To compare the heating and cooling needs of different countries, considering the climate, the number of degree days is used.
Malta, Cyprus, and Portugal have the lowest number of heating degree days. The number of heating degree days is highest in Finland, Sweden, Estonia, and Latvia (Figure 3).
However, if you compare the number of degree days of cooling in countries, the situation is the opposite. Malta, Cyprus, Spain and Italy have the most cooling degree days and the least in Ireland, Sweden, Finland, and Denmark (Figure 4).
Figure 3: Heating degree days
Source: Eurostat
Figure 4: Cooling degree days

Source: Eurostat
Heat consumption per capita in the Household sector
The average heat consumption of EU27 countries in the household sector was 0.530 MWh per capita in 2014 and 0.515 MWh in 2022. If the EU average indicator has decreased by only 2.8 percentage points over 2014-2022, then the changes are quite different when comparing the countries. In some member states the consumption of heat in the household sector has decreased during the period (for example, in Greece 42, in Portugal 34, in Slovakia 21, and in Italy 14 percentage points), while in other countries this indicator has increased (in France 19, in Belgium 17, in Estonia and Latvia 11, and in Lithuania approx. 10 percentage points). If we look at household heat consumption in 2022, it varies greatly among EU member states, from consumption below 0.001 MWh per inhabitant in Portugal and Belgium to consumption of around 3.31 MWh per inhabitant in Finland, 3.16 MWh in Denmark, 2.92 MWh in Estonia, 2.83 MWh in Sweden, and 2.27 MWh in Latvia (Figure 5).
Figure 5: Households heat consumption per capita in 2014 and 2022

Source: Enerdata2
Heat consumption trends
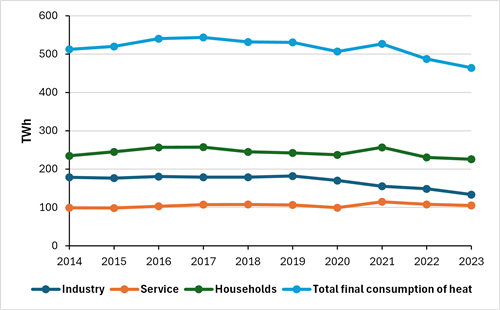
The final consumption of heat in the European Union has been stable in the last ten years and remained between 544 TWh in 2017 and 487 TWh in 2022. Compared to 2014, heat consumption in 2022 decreased by 9.4 percentage points. However, if we look at the trends in heat consumption by sector, it appears that in some sectors a decrease in consumption can be seen by 2022 compared to 2014 (for example, in industry by 25 pp and in households by 4 pp), while in the business and service sector, heat consumption had increased by approximately by 6 pp.
Heat consumption in households was fairly stable in the period 2014-2022 (between 257-226 TWh). Two-thirds of the consumed heat was used for heating, and one-third of the heat was used to prepare domestic hot water.
Figure 6: Heat consumption trends by sectors
Source: Odyssee database
Consumption of heat per unit of GDP
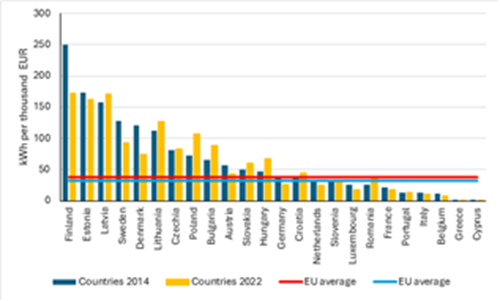
Heat consumption per unit of GDP (using purchasing power standards) in the EU in 2022 was 31.9 kWh per 1 000 euro. Compared to 2014, when the EU average indicator was 37.1 kWh per 1 000 euro, this indicator had decreased by approx. 14 percentage points by 2022 (Figure 6). The amount of heat consumed per unit of GDP depends on many factors, such as the general standard of living, the economy, and weather conditions, as well as the energy efficiency of buildings and appliances. Adjusting GDP to purchasing power standards allows countries to be compared more fairly.
The EU Member States with the lowest heat consumption per unit of GDP in 2022 were Cyprus, Greece, Belgium, and Italy. The highest rates of heat consumption per unit of GDP were registered in Finland, Estonia, Latvia, and Sweden (Figure 7).
In the period 2014-2022, this indicator increased the most in Poland (47 pp), Hungary (42 pp), Romania (41 pp), and Bulgaria (38 pp), while it decreased in Denmark (38 pp), Luxembourg (32 pp), Finland (31 pp), the Netherlands (28 pp), and Sweden (27 pp) (Figure 7).
Figure 7: Final consumption of heat per GDP(PPP), 2022
Source: Eurostat
Energy consumption per m2 for space heating with climatic corrections
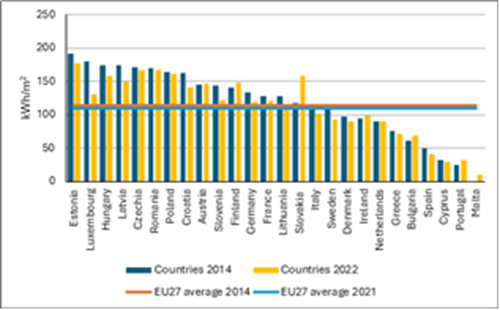
The EU27 average energy consumption per m2 in the household sector was 80 kWh/m2 in 2022 . Compared to 2014 (85 kWh/m2), this indicator had decreased by 3.3 percentage points. The unit consumption of heat decreased in the period 2014-20224 in almost all member states except for Portugal, Slovakia, Estonia, and Bulgaria, where the consumption of energy for space heating per m2 increased by 58.0, 10.4, 2.2, and 2.1 percentage points, respectively, during the observed period (Figure 8).
Figure 8: Household energy consumption per m2 (climate corrected)
Source: Odyssee
Main drivers of household energy consumption at EU level
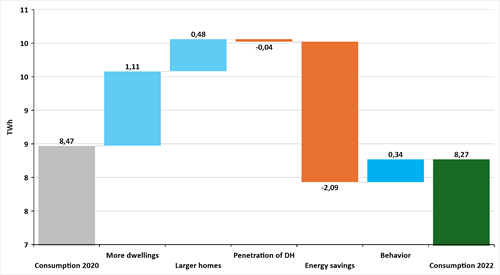
Between 2020 and 2022, the household sector heat consumption for space heating decreased by 0.2 TWh (2.4%). The growth of the housing stock and larger living spaces in both apartments and individual houses have contributed to the increase in heat consumption by approximately 1.93 TWh. Energy savings and the increase in the share of DH in residential heating have more than compensated for this increase, reducing consumption by 2.13 TWh.5
Figure 9: Drivers of household heat consumption at EU level
Source: Odyssee
Notes
- 1: Electricity and heat statistics. Eurostat. https://ec.europa.eu/eurostat/statistics-explained/index.php?title=Electricity_and_heat_statistics#Derived_heat_production
- 2: There are no data for Malta, Ireland, Spain, and Greece in 2022
- 3: No data for Belgium (2014 and 2021) and Malta (2014).
- 4: Please visit https://www.odyssee-mure.eu/
