Summary
Key questions
- What are the recent trends in energy efficiency?
- What are the sectors that achieved the most energy savings?
- What factors have been driving the variations in final consumption and total energy supply since 2021?
Lead authors: Bruno Lapillonne, Estelle Payan, Kévin Retailleau (Enerdata)
Reviewers:
A decrease in final consumption since 2021
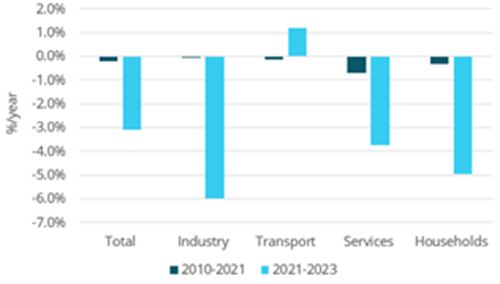
Total final energy consumption has decreased significantly since 2021 (-3%/year), driven by industry (-6%/year), households (-4.9%/year) and services (-3.7%/year) (Figure 1). Only transport consumption increased (+1.2%/year). Electricity consumption followed a similar trend. Previously, final and electricity consumption remained largely stable, with a slight decrease in services (-0.7%/year over 2010-2021).
Figure 1: Final energy consumption by sector
Source: ODYSSEE, data at normal climate
A surge in energy prices in 2021-2022
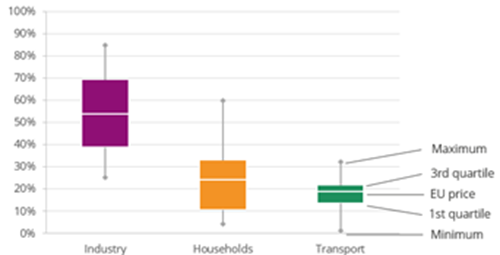
Part of the reduction in final consumption is explained by the surge in energy prices since 2021. In industry, energy prices increased by more than 50% in 2022, after a 16% rise in 2021 (Figure 2). Prices for households rose by 24%. In transport, the increase in motor fuel prices was more limited in 2022 (19%) but occurred after 15% growth in 2021 (around 30% over the 2 years). As a result, the average price for final consumers increased by 36% at EU level in 2022. The progression in transport consumption since 2021 occurred despite higher fuel prices.
Figure 2: Energy prices variation (2021-2022) by sector
Source: Odyssee
Faster energy efficiency gains since 2020
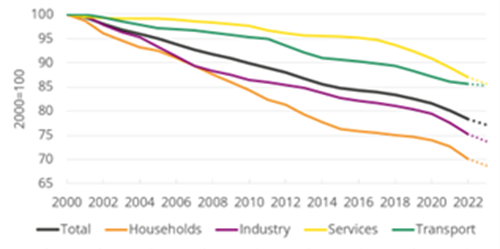
At the EU level, the energy efficiency of final consumers, as measured by ODEX1, has improved by an average of 1.1% per year since 2000 (i.e. by 23%) (Figure 3). These improvements have accelerated since 2019 (1.7%/year on average), after a slow progression between 2014 and 2019.
Energy efficiency progress has been the strongest for households (31%, 1.6%/year on average). This good result can be explained by the introduction of many regulations affecting buildings and appliances. For space heating, the reduction in heating consumption per m2 has accelerated since 2019 (-2%/year at EU level, i.e. above pre-2014 trends), with a rapid reduction in half of the largest consumers; this reflects the strong price increases in 2022 and a sustained effort in energy efficiency (increased penetration of heat pumps and acceleration of renovation activities).
In industry, energy efficiency progress has been significant since 2000 (1.3%/year). The pace of energy efficiency improvements has accelerated since 2019 (1.8%/year), after a period of slow progress from the financial crisis of 2008 until 2019 (0.9%/year).
Services and transport lag behind (0.7%/year on average since 2000). For transport, it is two times less than over 2007-2014, because the efficiency of cars has stopped improving since 2013. It has even deteriorated significantly since 2019, because of a decrease in the occupancy rate (-8% in 2020, with only a slight rebound since then). This situation contrasts with trends observed for the specific consumption of new cars, which, based on test values, is decreasing rapidly, with a net acceleration since 2020 (three times faster at EU level) linked to a rapid penetration of electric and hybrid cars: from 3% in 2019 to 21% in 2023 at the EU level. This performance gap reflects the effect of real driving conditions and behaviors compared to test values.
The recent intensification in energy efficiency progress for households and industry may be partly linked to the high energy prices since 2021, which cannot be well accounted for in the indicators.
Figure 3: Energy efficiency trends for final consumers (EU)
Source: Odyssee
Annual savings have increased since 2020
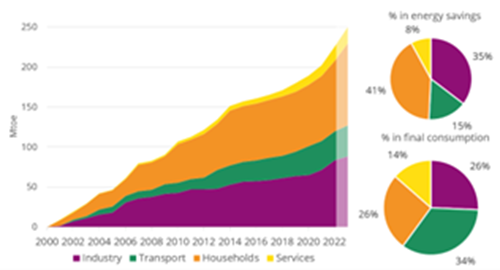
Energy efficiency improvements have led to significant energy savings, estimated at 250 Mtoe in the EU in 2023 compared to 2000 (Figure 4). Without these savings, final consumption would have been 29% higher in 2023, and EU households would have spent 540€ more in 2023 in their dwellings (+150€ including their expenses in motor fuels).
Figure 4: Energy savings and final consumption (EU)
Source: ODYSSEE Energy saving tool2; data at normal climate.
Annual additional savings have increased significantly since 2020 (17 Mtoe/year), well above the average registered between 2000 and 2014 (10 Mtoe/year), and three times more than savings measured over 2015-2019. Together, industry and households accounted for 77% of these savings, while representing 52% of final consumption. Transport and services lag behind, with a share of savings much lower than their share in final consumption.
Since 2021, energy savings have more than offset increase in activity
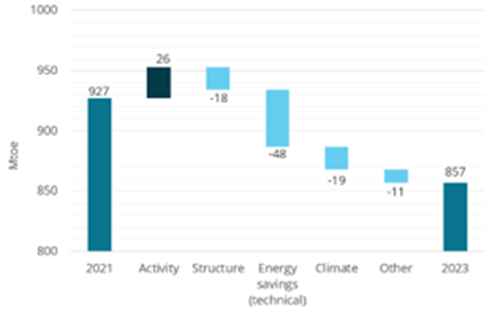
Final energy consumption in 2023 was 70 Mtoe lower than in 2021 (Figure 5).
Figure 5: Drivers of final energy consumption variation at EU level between 2021 and 2023
Source: ODYSSEE Decomposition tool3
Economic and population growth, and the increase in traffic and in the number of household appliances (“activity”) contributed to an increase in final consumption of 26 Mtoe (35% from transport, 30% from services). Energy savings more than offset this activity effect and reduced consumption by 48 Mtoe, of which around 45% for households, 35% in industry. Climatic differences between these two years were particularly significant (2023 being warmer than 2021) and reduced consumption by a further 19 Mtoe.
Energy savings and decarbonation have driven CO2 emissions reduction since 2010
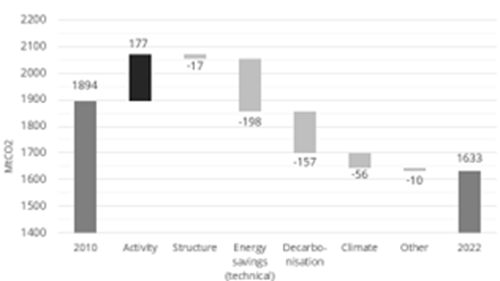
Between 2010 and 2022, CO2 emissions from final energy consumption decreased by 261 MtCO2 (-14%) (Figure 6). The activity effect contributed to increase CO2 emissions by 177 MtCO2 (30% in both industry and transport). Energy savings and decarbonation of the energy mix offset more than two-fold this activity effect by reducing consumption by 198 MtCO2 and 157 MtCO2, respectively. Climatic variations also contributed to the reduction, cutting emissions by 56 MtCO2.
Figure 6: Drivers of CO2 emissions reduction 2010-2022
Source: ODYSSEE, CO2 decomposition tool4
A much higher reduction for total supply than for final consumption since 2021
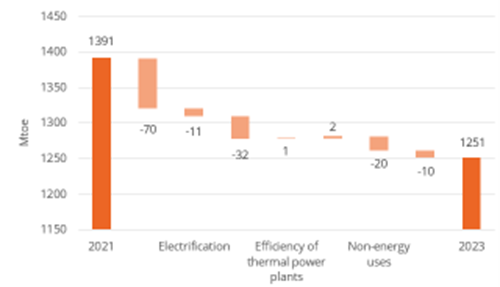
From 2021 to 2023, total energy supply (i.e. primary energy consumption) decreased two times faster than final consumption: -140 Mtoe compared to -70 Mtoe (Figure 7). Almost 50% of this difference is explained by changes in the power mix: a higher share of renewables (+8 pts) and lower shares of thermal (-5.5 pts) and nuclear (-2.5 pts), which reduced total supply by 32 Mtoe. Non-energy uses also contributed significantly to this decrease (-20 Mtoe), with a drop in petrochemical production linked to high gas prices.
Figure 7: Drivers of EU total energy supply variation
Source: ODYSSEE Decomposition tool
Energy efficiency first principle
If we combine energy savings from final consumers and energy savings from the power sector (linked to changes in the power mix and energy efficiency improvements for thermal power generation), total energy savings add up to 428 Mtoe in 2023 (58% from final users and 42% from the power sector). If we added up the savings since 1990 (instead of 2000), energy efficiency would be by the first fuel in 2023 (Figure 8).
Figure 8: Primary energy consumption and savings in the EU

Source: ODYSSEE Energy savings tool
Conclusions
The rate of energy efficiency improvement has clearly accelerated since 2019. The various crises did not play a negative role in energy efficiency, because of the intensification of policy measures and higher prices; this is particularly true in industry and for households.
Transport shows mitigated results: poor savings for cars but the diffusion of electric vehicles should provide good results in the future.
Behaviours play an increasing role for both cars and heating: negative for cars but positive for households. For households, part of this may be due to higher energy prices and may be partly reversible.
Since 2021, energy savings contributed strongly to the rapid decrease in consumption. Behaviours, structural changes, and climate also contributed.
Total energy supply has decreased much faster than final consumption because of a higher contribution of wind and solar in the power mix; this decoupling will continue in the future, with a growing share of renewables in power generation.
Notes
- 1: ODEX is the indicator used in ODYSSEE-MURE to measure the energy efficiency progress by sector. For each sector, the index is calculated as a weighted average of indices of specific consumption by sub-sector, end-use, or transport mode. For more information on ODEX: https://www.indicators.odyssee-mure.eu/odex-indicators-database-definition.pdf
- 2: For more information, see: https://www.indicators.odyssee-mure.eu/energy-saving.html
- 3: For more information, see: https://www.indicators.odyssee-mure.eu/decomposition.html
- 4: Emissions of final consumers (i.e. industry, transport, housholds and services). For more information, see: https://www.indicators.odyssee-mure.eu/co2-decomposition.html
