Summary
Key questions
- What is the overall trend in transport energy consumption in the EU since 2000?
- What are the main drivers for the energy consumption variation in transport and especially for energy savings?
Reviewers: Lena Kappler (Fraunhofer ISI)
Increasing energy consumption since 2013
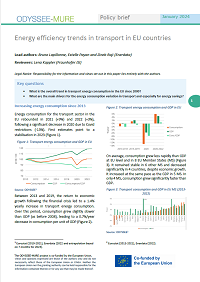
Energy consumption for the transport sector in the EU rebounded in 2021 (+9%) and 2022 (+3%), following a significant decrease in 2020 due to Covid restrictions (-13%). First estimates point to a stabilisation in 2023 (Figure 1).
Figure 1: Transport energy consumption and GDP in EU

Source: ODYSSEE1
Between 2013 and 2019, the return to economic growth following the financial crisis led to a 1.4% yearly increase in transport energy consumption. Over this period, consumption grew slightly slower than GDP (as before 2008), leading to a 0.7%/year decrease in consumption per unit of GDP (Figure 2).
Figure 2: Transport energy consumption and GDP in EU

On average, consumption grew less rapidly than GDP at EU level and in 8 EU Member States (MS) (Figure 3). It remained stable in 6 other MS and decreased significantly in 4 countries, despite economic growth. It increased at the same pace as the GDP in 5 MS. In only 4 MS, consumption grew significantly faster than GDP.
Figure 3: Transport consumption and GDP in EU MS (2013-2022)

Source: ODYSSEE2
Half of the energy consumption from cars and over 30% from trucks and light duty vehicles
The modal split of consumption only changed slightly between 2010 and 2022; the share of cars decreased marginally (-2 pp), while that of LDVs increased somewhat (+1.5 pp). Road transport represents 95% of the consumption, while domestic air, rail, and water transport only account for around 2% each (Figure 4).
Figure 4: Transport consumption by mode in the EU (2010, 2022)

Source: ODYSSEE
New cars are more efficient since 2013
The specific consumption of new thermal and electric cars has decreased rapidly at EU level since 2013 (- 5%/year), with the greatest progress in Sweden (- 10%/year), followed by Finland, the Netherlands, and Denmark (-7%/year). The reduction in specific consumption has accelerated since 2019 thanks to the rapid penetration of electric and hybrid cars, which went from 3% in 2019 to 22% in 2022 at EU level (12% for BEV) (Figure 5).
Figure 5: Energy efficiency of new cars (goe/km) in EU MS

Source: ODYSSEE from EEA, WLTP standard
Decline in the energy efficiency of the car stock
At EU level, energy efficiency improvements for cars were limited until 2019 and have increased since then. Some countries show significant improvements over the whole period (Greece, Ireland, and France) (Figure 6). Such improvements are linked to different factors: more efficient cars, smaller cars (France and Ireland), or behaviour (Greece). This contrasts with observations for new cars, which correspond to test values, and do not include the effects of load factors.
Figure 6: Evolution of energy efficiency of the car stock (koe/pkm) by EU MS

Source: ODYSSEE
Efficiency of road freight transport is improving
At EU level and in many EU countries, the unit consumption of transport by trucks has decreased by more than 1%/year since 2000, reflecting energy efficiency improvements (Figure 7). This trend has generally accelerated since 2014 (to around 1.6%/year at EU level), driven by a combination of higher load factors (i.e. tkm/vehicle) and more efficient vehicles.
Figure 7: Energy efficiency of trucks (goe/tkm) in EU MS (2000-2021)

Source: ODYSSEE - Only countries with data on trucks are shown
Energy efficiency improved by 13% since 2000
In ODYSSEE, energy efficiency trends for the transport sector are summarised by an index called "ODEX"3. It is calculated by weighting the indices of variation of specific consumption for 8 transport modes by the share of each mode in transport consumption. Depending on the mode, specific consumption is expressed in different physical units to better assess energy efficiency4.
Since 2000, energy efficiency in transport has improved by 0.7% per year in the EU, i.e. by a total of 13% (Figure 8). Progress has been significant for trucks and light vehicles since 2012, after no progress between 2008 and 2012 following the financial crisis (less efficient operation of trucks with lower load and empty running). Cars have shown slight progress since 2013, while greater improvements have been achieved for air transport.
Figure 8: Energy efficiency index by mode in the EU

Source: ODYSSEE; buses, motorcycles, water and rail not shown
Freight modal shift is going the wrong way
The share of rail and inland waterways has been declining since 2000 in two thirds of EU MS, although the downward trend has slowed since 2010 (-2.7 pts since 2010 at EU level). A few countries have experienced a shift from road to rail and water, including Spain (+3 pts), Finland, and Italy (+1 pt). Lithuania, Latvia, Romania, and the Netherlands are leading with a share of around 50% or higher, due to the good quality of the rail lines to seaports combined with heavy maritime traffic (Figure 9).
Figure 9: Share of rail and water in freight traffic (%)

Source: ODYSSEE
The share of public transport in passenger traffic has declined since 2019
The share of public transport progressed in only eight countries between 2010 and 2019, especially in Sweden (+5 pts) and Slovakia (+4 pts). It has, however, decreased at EU level and in 70% of countries (by 1 point at EU level).
Since the Covid crisis, which affected many public modes, the share of public transport has fallen in most EU countries (-4 pts at EU level to 15% in 2021) (Figure 10). Before Covid, Czechia had the highest share of public transport (33% in 2019) followed by Hungary and Austria (around 30%) (Figure 10).
Figure 10: Share of public transport in passenger traffic (%)

Source: ODYSSEE
Energy savings have offset 50% of the rise in consumption over 2000-2019
Between 2000 and 2019, the increase in traffic (activity effect) contributed to raise transport consumption by 48 Mtoe, with an equal contribution of freight and passengers. The growing share of trucks in freight traffic and, to a lesser extent, of cars in passenger traffic (modal shift effect) also contributed to the increase in consumption (around 6 Mtoe). Energy savings offset half of the activity and modal shift effects, thus limiting the rise in consumption to 27 Mtoe (Figure 11).
Figure 11: Decomposition of transport consumption variation (EU, 2000-2019)

Source: ODYSSEE Decomposition tool5
Energy savings offset 75% of the increase in consumption over 2019-2022
First estimates show that the growth in passenger traffic contributed to raise final consumption by 6.5 Mtoe over 2019-2022, while freight traffic only increased it by 3 Mtoe. The modal shift further increased consumption by 2 Mtoe, and energy savings offset 75% of the overall consumption increase. In 2022, soaring motor fuel prices (+15% to 20%) resulted in a significant decline in consumption (“constrained sufficiency”), as shown in “others” (Figure 12).
Figure 12: Decomposition of transport consumption variation (EU, 2019-2022) – first estimates

Source: ODYSSEE Decomposition tool
Decoupling between CO2 emissions and consumption
A decoupling between CO2 emissions and consumption can be observed as the carbon emission factor has decreased (-0.4%/year since 2018 and -0.6%/year over 2004-2012), driven by a higher share of electricity and biofuels in the energy mix.
In 2022, emissions were only 1.5% higher than in 2000, while consumption was 8% higher.
Figure 13: Evolution of transport consumption and CO2 emissions in the EU

Source: Eurostat (2013-2021), Enerdata (2022).6
Notes
- 1: Eurostat (2010-2021), Enerdata (2022 and extrapolation based on 7 months for 2023).
- 2: Eurostat (2013-2021), Enerdata (2022).
- 3: https://www.odyssee-mure.eu/publications/other/odex-indicators-database-definition.html
- 4: koe/pkm for cars, buses and aviation, koe/tkm for trucks, water and rail, koe/km for light vehicles, toe/veh for motorcycles.
- 5: https://www.indicators.odyssee-mure.eu/decomposition.html
- 6: Only direct CO2 emissions, which do not include emissions due to electricity supply for electric vehicles.
January 2024