Summary
Key questions
- What have been the main drivers of the primary and final energy consumption in the EU since 2000?
- How fast energy efficiency is improving?
Lead authors: Bruno Lapillonne and Laura Sudries (Enerdata)
Reviewers: Aline Guilmot (FOD Economie), Joost Gerdes (TNO)
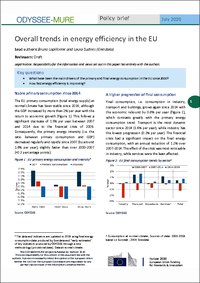
Stable primary consumption since 2014
The EU primary consumption (total energy supply) at normalised climatic conditions1 has slightly increased since 2014, although GDP increased by more than 2% per year with the return to economic growth (Figure 1). This follows a significant decrease of 1.5% per year of primary consumption between 2007 and 2014 due to the financial crisis of 2009. Because GDP still increased slightly, the primary energy intensity (i.e. the ratio between primary consumption and GDP) decreased regularly and rapidly since 2007 (by around 1.8% per year), slightly faster than over 2000-2007 (+0.3 percentage points).
Figure 1 : EU primary energy consumption and intensity2

Source: Odyssee
A higher progression of final consumption
Final consumption (i.e. consumption in industry, transport and buildings) has also grown since 2014. After the economic recovery, it increased by 0.8% on average each year (Figure 2). This contrasts greatly with the primary energy consumption trend. Since 2014, the transport sector experienced the highest growth (1.6% per year), while industry has experienced the lowest progression (0.2% per year). The financial crisis had a significant impact on the final consumption, with an annual reduction of 1.2% over the years 2007-2014. The effect of the crisis was most noticeable in industry, while services were the least affected.
Figure 2: EU final consumption trends by sector3

Source: Odyssee
Between 2014 and 2019, the EU primary energy consumption increased by 17 Mtoe, i.e. three times less than the final consumption (+50 Mtoe) (Figure 3). This increase in primary consumption lower due to two key factors:
- A significant change in the power mix (a higher share of renewables and a lower share of nuclear), which improved power generation efficiency4;
- Increases in efficiency of thermal power generation, due to a shift from coal to gas.
These two effects together have reduced the increase in primary consumption by 23 Mtoe and 20 Mtoe respectively (Figure 3).
Figure 3 : Drivers of EU primary energy consumption variation5

Source: Odyssee
Energy efficiency progress is slowing down
At the EU level, energy efficiency of final consumers, as measured by ODEX6, improved by an average of 1.2 % per year between 2000 and 2019. Efficiency improvements have however slowed in later years, averaging 0.9% improvements per year since 2014 (Figure 4).
Energy efficiency progress has been the strongest for households (2.1% per year on average), however this has also slowed since 2014 (to 1.6% per year). This overall trend can be explained by the introduction of the many regulations affecting buildings and appliances.
In industry, the pace of energy efficiency improvements has been more than halved since the financial crisis (0.8 % per year since 2007, compared with 1.8 % per year between 2000 and 2007).
In transport, energy efficiency has been steadily improving by 1 % per year, mainly thanks to cars. Efficiency gains slowed down for other modes.
In services, a lack of end-use data means only part of the energy efficiency improvements can be measured with the available indicators7.
Figure 4: Energy efficiency index for final consumers (EU)

Source: Odyssee; air transport included
Around 270 Mtoe of energy savings in 2019
Energy efficiency improvements led to significant energy savings, with an estimated 270 Mtoe saved in 2019 compared with 2000 (Figure 5). These savings represent the sum of the additional annual energy savings by sector and are equivalent to 25 % of final energy consumption. In other words, without these energy efficiency improvements since 2000, the final energy consumption would have been 25% higher in 2019. Because of the slowing pace of energy efficiency improvement, the annual additional savings have been regularly decreasing: from an average volume of 16.5 Mtoe per year over 2000-2007 to 14.5 Mtoe per year over 2007-2014 (divided by 3 in industry) and 11 Mtoe per year since 2014 (one third reduction for households).
Figure 5: Energy savings in 2019 compared with 2000 and final consumption by sector (EU)

Source: Odyssee; air transport included
Most of the savings were in the households sector (46 %) (Figure 6). Industry and transport contributed equally to EU final energy savings (25% each). Savings in transport are much lower than their share in consumption and households are over represented (46% of total savings compared to a share in final energy consumption of 27%, i.e. 19 percentage points lower). As a result, savings represented 43 % of total residential consumption in 2019. This very favourable situation of households is mainly explained by the importance of policy measures implemented in that sector, in particular EU regulation.
Energy savings have partially offset the activity effect
To allow for an easy analysis of the driving factors behind the energy consumption trend, the ODYSSEE-MURE project developed a decomposition tool8 separating the impacts of the main drivers on the energy consumption variation between two years into the following effects:
- an activity effect – mainly economic growth, including also demography, changes in appliance ownership and larger dwellings;
- structural effects – covering changes in the structure sectors. E.g. the value added in industry among the various branches or modal shift in transport;
- energy savings – covering energy efficiency improvements (as presented above);
- climate effect – covering impacts of temperature variation between the two years;
- other effects – those not included above.
The final energy consumption was 50 Mtoe higher in 2019 than in 2014 (Figure 6). Economic and population growth (“activity”) contributed to rise the final consumption by 95 Mtoe. Energy savings offset more than half of this activity effect and contributed to lower consumption by 55 Mtoe.
Figure 6: Drivers of final energy consumption variation at an EU level between 2014 and 2019

Source: Odyssee; air transport included
Are we got off track?
Energy efficiency targets are always difficult to define, they can be expressed in terms of:
- Energy intensity reduction;
- Energy consumption reduction compared to a baseline projection;
- Energy savings;
- Energy consumption target level (i.e. a consumption cap).
Energy intensity targets used to be quite common, however they are now used less frequently as the energy intensity may result from other factors than energy efficiency.
The EU has been using the three targets types listed above in a complementary way. This can be seen by referring to the the most recent update of the EU Energy Efficiency Directive (EED) and its targets:
- 32.5% energy saving target in 2030 (20% in 2020), for the EU as whole, compared to PRIMES 2007 (a baseline projection);
- 1.5% additional energy savings until 2020 and 0.8% over 2021-2030 to be obtained from energy savings obligation with energy companies or alternative policy measures (Article 7)9;
- Primary and final energy consumption targets by country (Article 3).
Figure 7: Primary and final energy consumption targets

Source: Odyssee
In 2019, EU primary consumption was close to the 2020 efficiency target (around 4% above, as shown in Figure 7). The EU’s 2020 target for primary consumption will be easily reached due to the COVID crisis, which will decrease consumption by 5 to 10% in 2020, according to our estimates.
The EU’s target for 2030, however, cannot be reached with present trends and additional measures are therefore required. This has been recognised by the implementation of Article 7. Energy savings from Article 7 as reported by MS reached 40% of 2020 target in 2017, our estimate based on indicators exceed the target but cover more energy savings categories than Article 7 (calculations include all types of savings: policy related and from autonomous progress)(Figure 8).
Figure 8: Article 7 energy savings and target10

Source: Odyssee
Notes
- 1: See methodology of climate corrections at https://www.odyssee-mure.eu/faq
- 2: The data and indicators are updated to 2019 using final energy consumption data produced by Enerdata and “early estimates” of key indicators produced by ODYSSEE through a new methodology (provisional data). Data at normal climate. The sole responsabilty of these estimates lies with the authors.
- 3: Consumption at normal climate; Sources of data: 2000-2018: based on Eurostat ; 2019: Enerdata preliminary estimates.
- 4: Renewables are assumed to have an efficiency of 100%, compared to 33% for nuclear and 40-50% for thermal.
- 5: For more information on this decomposition of consumption, see the decomposition tool.
- 6: ODEX is the indicator used in the ODYSSEE-MURE project to measure the energy efficiency progress by sector (industry, transport, households) and for all final consumers. For each sector, the index is calculated as a weighted average of indices of specific consumption by sub-sector (branches in industry or services end-uses for households or transport modes). For more information on ODEX: www.indicators.odyssee-mure.eu/odex-indicators-database-definition.pdf
- 7: This is especially true for electricity where the uptake of more efficient appliances has been offset by an increased use of air-conditioning and information and communications technologies.
- 8: decomposition tool
- 9: Savings defined as a percentage of a reference consumption.
- 10: Energy savings, including savings from Article 7 are compiled in the energy savings tool.
July 2020