Summary
Key questions
- Does the EU emissions trading system ETS have an effect on energy savings in ETS industry?
- What can be done to increase the effect of the ETS on energy efficiency in industry?
Lead authors: Joost Gerdes (ECN)
Reviewers: Eugenia Bonifazi (Ricardo Energy and Environment), Francis Altdorfer (Econotec)
Introduction to the EU ETS
The idea behind the European emissions trading system ETS is to create an incentive for reducing the emissions of greenhouse gases in an economically favourable way by putting a price on emissions. This is done by setting a cap and making emission allowances tradable. The ETS does not cover all CO2 emissions, but only those of large emitters in power generation and industry. The ETS covers around 45% of all greenhouse gas emissions in the EU1. The cap is lowered over time. The price is set by supply and demand for emission allowances, and greenhouse gas emitters can decide if they want to use emission allowances or to apply measures to reduce emissions. This way, emission reductions can be reached for the lowest amount of money.
The EU ETS consists of different phases. The first phase was a three year pilot period from 2005 to 2007. The second phase covered 2008 to 2012 and coincided with the first commitment period of the Kyoto Protocol. All emission allowances in the first period and 90% of allowances in the second period were handed out for free. Phase three covers 2013 until 2020. In contrast to earlier periods it has a single, EU wide cap instead of national caps and auctioning is the default method for allocating allowances. In practice this applies mainly to power generation, as there is still free allocation for most of industry.
Allowance prices started around 20 euros per ton, peaked in April of 2006 and went down from there until the current level around 5 euro per ton2. The reasons for this development will be discussed further below.
Effects of ETS on sectors covered by Odyssee
The Odyssee database contains data about the energy consuming activities, energy consumption and efficiency indicators of end use sectors. Energy conversion sectors like power plants and refineries are not covered. This means that an analysis of the effects of the ETS by making use of Odyssee data can only address manufacturing industries.
Accurate analysis of energy efficiency makes use of physical production quantities rather than monetary ones. The manufacturing industries for which physical production quantities are available in Odyssee are the steel, cement, paper and glass industries. Analysing developments in these industries individually using Odyssee data does not show an effect of the ETS on energy efficiency; there is no clear sign of an increase in energy efficiency that can be attributed to the start of the ETS, neither on country nor on EU level.
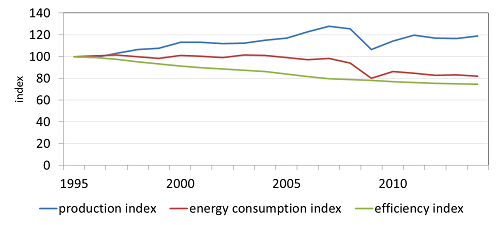
For further analysis, Odyssee data for all manufacturing industries at the EU level combined were used3. Figure 1 shows indices for the production, the final energy consumption and the Odyssee efficiency for the manufacturing industry in the EU. The efficiency index as depicted in Figure 1 has a gradual slope due to the methodology used, among which an averaging over three years.
Figure 1: Indices for production, final energy consumption and efficiency for the manufacturing industry in the EU from 1995 until 2014 (1995 = 100)

Source: Odyssee
The effects of the crisis of 2008 are clear from the large decrease of both the production volume and the energy consumption. Because the production volume and the energy consumption both decreased by a comparable fraction, changes in the slope of the efficiency index are not very apparent.
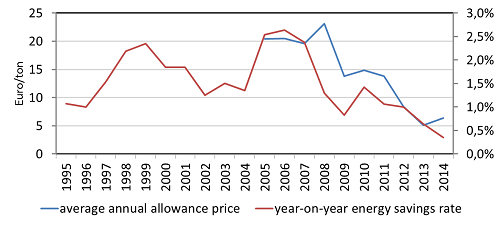
For better insight, one can derive an annual energy savings rate from the efficiency index. This rate is displayed together with the emission allowance price in Figure 2. The figure shows that the savings rate peaked at around 2.5% per year during the late nineties and from 2005 until 2007. It also shows that high savings rates have occurred in the nineties, before the start of emission trading.
Figure 2: Emission allowance price and the energy savings rate in EU manufacturing industry

Source: emission allowance price: PointCarbon, ICE, investing.com; savings rate: ECN, based on Odyssee index
Investments in industrial equipment usually result in improved energy efficiency. The high savings rate during the late nineties and between 2005 and 2007 are probably related to the high investment levels during these years with high economic growth. The high rate from 2005 until 2007 could also be related to the relatively high allowance price during these years. Although the allowance price still increased during the start of the financial crisis in 2008, savings went down considerably from there because of lower investments in industrial equipment.
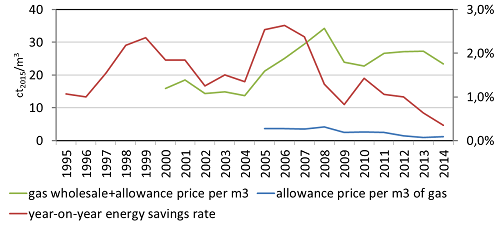
Figure 2 shows that the energy savings rate went down considerably before allowance prices did, so the decrease of the savings rate was probably not caused by lower allowance prices, although the three-year average savings rate also includes one future year. Allowance prices went down as a result of lower demand due to the crisis. It is possible that expectations of higher allowance prices have had an effect on energy savings from 2005 until 2007, although energy prices and especially the effects of economic growth, visible in the production index of Figure 1, were probably dominant. To illustrate this, Figure 3 shows the wholesale natural gas price including the allowance price per m3 and the allowance price separately. With a share of around 33%, natural gas is the largest fossil fuel in industry.
Figure 3: Wholesale price of natural gas including allowance price per m3, the allowance price per m3 and the energy savings rate in EU manufacturing industry

Source of gas price: TTF
It is clear that the allowance price has only resulted in a small price increase for gas. An expectation of rising allowance prices in 2005 and of rising gas prices may have stimulated savings measures, but savings went down starting with the crisis of 2008 despite still increasing gas prices. Lower investments due to the crisis were probably the dominant cause of lower savings rate. It is unlikely that the allowance price incentivises investments in energy efficiency at all at the current price level. Without a prospect of significantly higher allowance prices this will not change.
Explanation of the limited effect of ETS
Figure 2 shows that allowance prices have started at a relatively high level, and have become very low in recent years. There are multiple reasons for the oversupply that causes the low prices:
- The ETS was designed in such a way that the amount of available allowances does not respond to changes in economic development. With the crisis of 2008, emission levels decreased due to a slowdown in economic activity, but no allowances were cancelled.
- Allowances that have not been used in a specific year are not cancelled, but can be used later (‘banking’).
- Many large industrial companies that compete internationally, and are at risk of so called ‘carbon leakage’, receive free allowances to avoid too high production costs compared to those of their competitors outside the EU.
- A benchmark is used to estimate the number of free allowances needed to cover the emissions related to the different production processes. However, more allowances have been handed out than needed to cover the emissions caused by the production because the amount was based on estimates of production volumes before the crisis.
- Large-scale application of the so-called flexibility mechanisms to acquire emission reduction credits by ‘Joint Implementation’ and the ‘Clean Development Mechanism’ (JI/CDM). These enable participants to achieve emission reductions more cost effectively in countries outside the EU.
- Interaction with other policies. The EC has introduced targets for energy efficiency and renewable energy that reduce the need for emissions allowances. Strictly speaking, this is a distortion of the ETS systematics.
- The amount of available allowances is higher than the cumulative emissions that are in accordance with attaining the long term decarbonisation targets of the EU.
Options to increase the effect of the ETS on energy efficiency improvements
Two possible solutions to increase the effect of the ETS on energy efficiency in industry are described in the following. The first is to make sure the allowance price becomes consistently higher. This will ensure that investing in energy efficiency will still be attractive during economic downturns, although the available data give no indication at what price level the effect will become noticeable. The second option is to start from limiting the yearly availability of allowances irrespective of allowance prices. If no allowances are available, no emissions will occur even if the allowance price would still be low. These goals can be achieved in several ways:
- Remove allowances from the market. The Market Stability Reserve can do this, although its purpose is to keep the allowance price stable. Currently, allowances are removed from the market only temporarily. Definitive removal of allowances will have more effect on allowance prices.
- Remove allowances from the market whenever a large emission source disappears as a result of other policy, for example when a coal fired power plant is closed.
- Introduce a floor price. This requires setting a price level that is high enough to incentivise measures on its own to be effective. Disadvantages are that the idea of a market mechanism will be partly abandoned, and that no consensus exists on how high an effective floor price should be.
- Cancel the allocation of free allowances completely. The effects can be compensated by other policies.
- Increase the rate at which the emission ceiling goes down.
- Cancel the complete surplus of allowances in order to comply with the long term EU policy targets. Do this in such a way that the cumulative amount of allowances is compatible with the goals of the Paris Agreement. Estimates have been made of the cumulative amount of greenhouse gases that can still be emitted while staying below a temperature increase of 2 or 1.5 ˚C4.
- Limit the amount of allowances that may be banked. Companies often focus on short term goals. A limit on banking will make sure that measures are taken now instead of being postponed while borrowing allowances from the future and counting on future solutions.
Conclusion and recommendation
An effect of the EU ETS on energy efficiency improvement in manufacturing industry in the 28 EU member states cannot be clearly derived from the data as collected and processed by the Odyssee database. There may have been an effect from 2005 to 2007, but it is highly likely that the economic growth during these years had a larger effect on efficiency improvements than the allowance price, also because the much higher wholesale price of energy had no discernible effect.
To incentivise energy efficiency measures in industrial companies, allowance prices should increase substantially or the yearly availability of allowances should be limited in a gradual and predictable way. The most obvious way to achieve this is to gradually reduce the annual amount of available allowances in a way that is compatible with the goals of the Paris Agreement. Moreover, this will increase the likelihood that this important target will be met.
Notes
- 1: http://ec.europa.eu/clima/policies/ets_en
- 2: Source: EUA futures TheICE.com
- 3: Production quantities partly physical, partly monetary
- 4: E.g. PBL Netherlands Environmental Assessment Agency (in Dutch only)


